

Debugging failed or flaky tests can be difficult when relying only on logs and error messages. To solve this problem, Playwright provides a powerful debugging feature called the Trace Viewer.
Trace Viewer records detailed information while a test is running and allows you to visually inspect the complete test execution.
A trace contains comprehensive data such as:
- All Playwright actions (clicks, fills, navigations)
- DOM snapshots at each step
- Screenshots captured during execution
- Network requests and responses
- Browser console logs
- Errors and stack traces
- Timing information for each action
Because of this level of detail, Trace Viewer is extremely useful for analyzing:
- Test failures
- Flaky tests
- CI/CD failures where the browser UI is not visible
Enabling Trace Viewer in Playwright
Tracing is configured inside the playwright.config.js file.
This configuration means:
- Traces are collected only when a test fails
- The trace is saved on the first retry
- Storage usage is minimized
- This setup is ideal for CI environments
A retry means that when a test fails, Playwright automatically reruns it based on the retry configuration. Trace Viewer captures the execution during this retry, which is usually enough to understand the failure.
Although it is possible to enable tracing for all tests, doing so is generally not recommended because trace files consume storage and are usually not needed for passing tests.
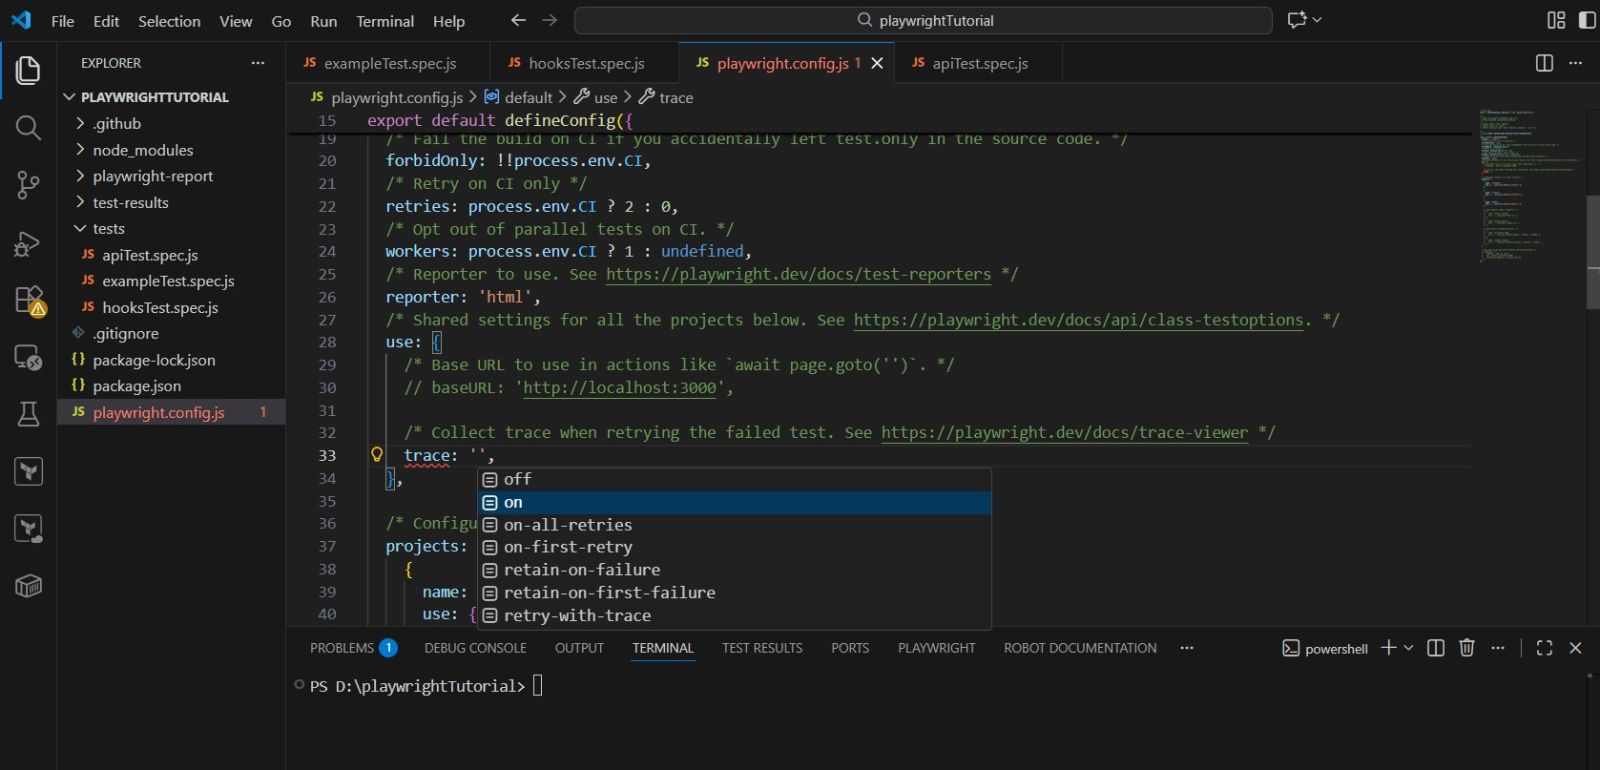
Trace Options in Playwright Config file
Playwright provides several trace options:
(i) trace: 'on' // Collect trace for every test
(ii) trace: 'off' // Disable tracing
(iii) trace: 'retain-on-failure' // Save trace only for failed tests
(iv) trace: 'on-first-retry' // Save trace on first retry (recommended)
Enabling Trace Viewer at the time of Execution
Traces are typically used in Continuous Integration (CI) environments, where browser UI is not available, and failures must be analyzed after execution. For debugging purposes, we can enable trace viewer for a particular test while executing it locally using the command: npx playwright test --trace on
When tracing is enabled through the Playwright config file or via a CLI option at runtime, Playwright automatically generates trace files.
Opening the Trace from the HTML Report
Traces can be opened directly from the HTML report when tracing is enabled.
Open Trace from Test List
In the HTML report:
1. Locate the test entry
2. Click the trace icon next to the test name
3. This action opens the Trace Viewer for that specific test.
Understanding the Trace Viewer UI
The Trace Viewer UI is divided into multiple sections to help you analyze failures effectively.
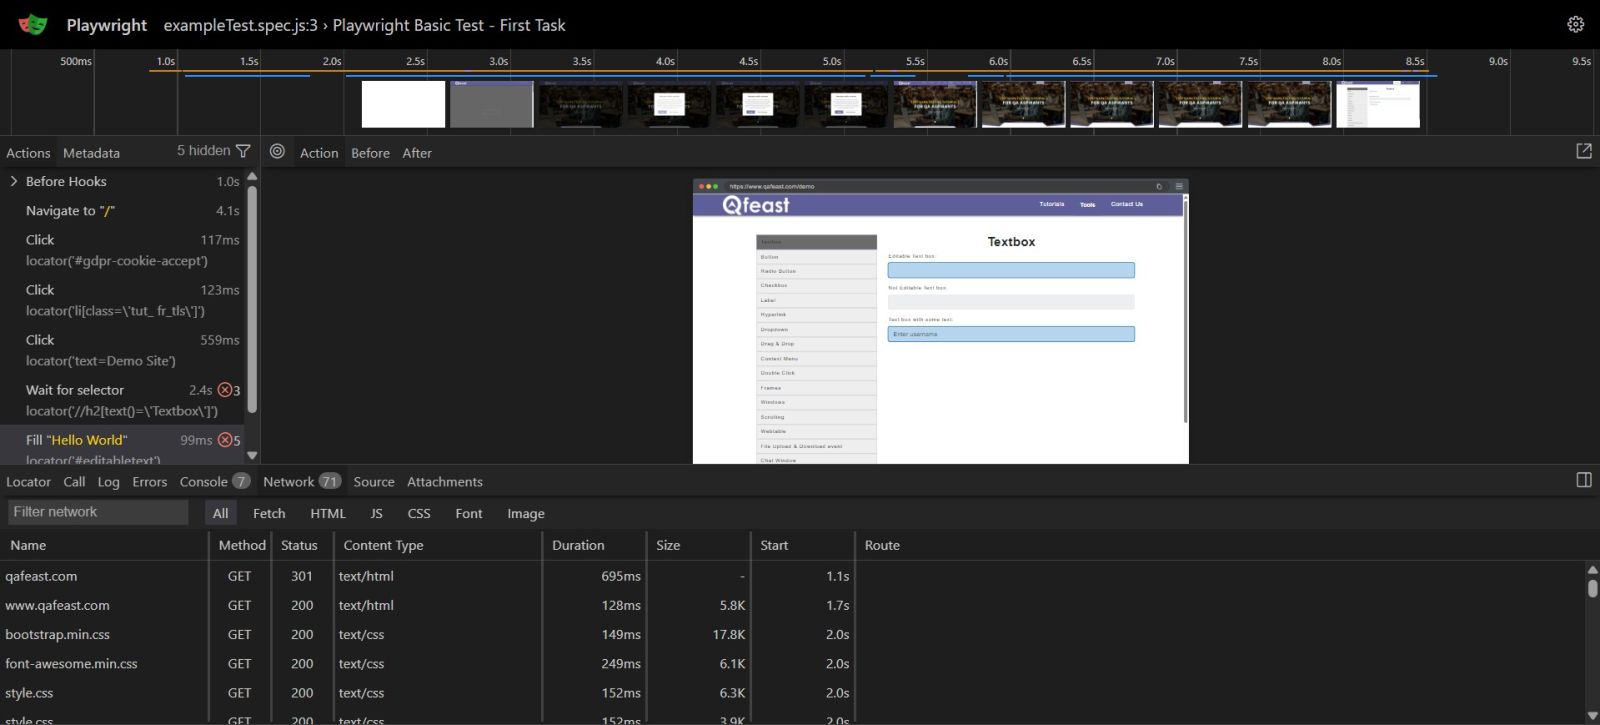
Timeline Panel
The Timeline panel lists all actions performed during the test execution. You can click on any step to inspect what happened at that exact moment.
Action Details
This section shows the Playwright command that was executed and highlights the target element involved in the action.
DOM Snapshot
The DOM Snapshot displays the state of the page at the selected step. You can inspect the HTML structure and styles exactly as they were during test execution.
Network Tab
The Network tab shows all API calls made during the test. This is especially useful when debugging backend-related issues or API failures.
Console Tab
The Console tab displays browser console logs and JavaScript errors captured during the test.